
Exploring Road Safety Trends with Data and Tools
Understanding road crash statistics is essential for identifying trends and key road safety issues. By analysing this data, students and educators can gain valuable insights into the causes and patterns of crashes, which helps inform effective safety strategies and awareness programs. Exploring these statistics encourages critical thinking and promotes a proactive approach to improving road safety in our communities.
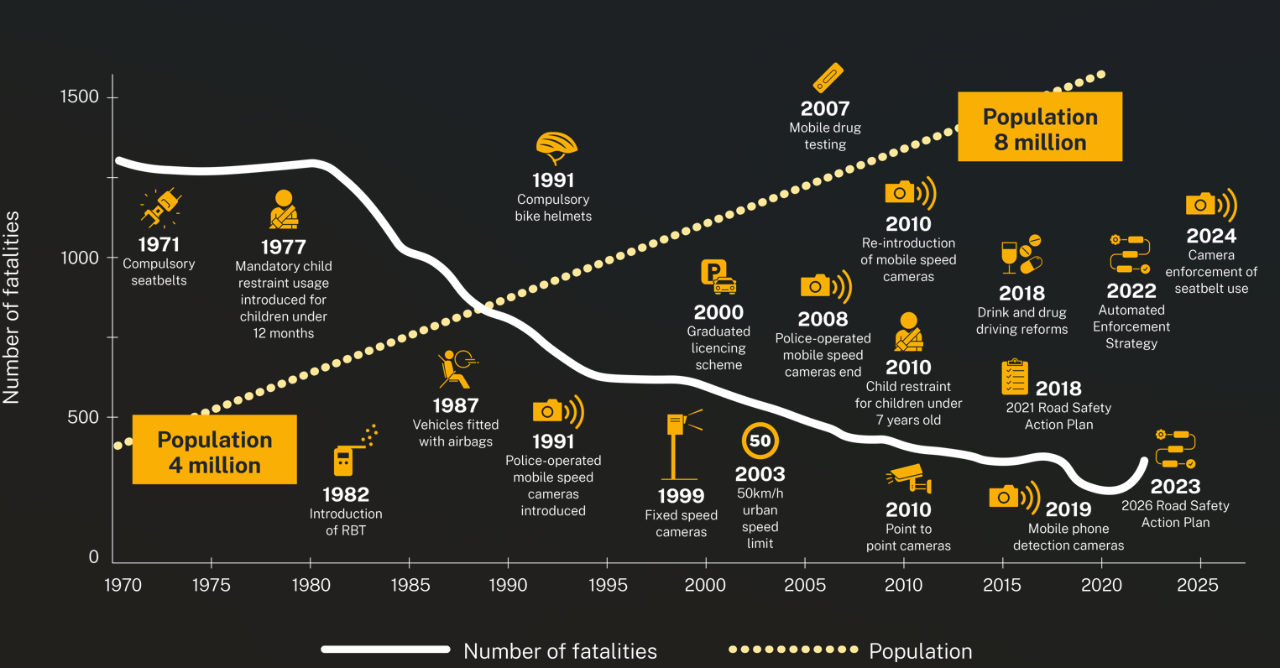
Teachers and students have access to a wide range of tools and data sources to help understand road safety trends at local, state, national, and global levels. By examining this diverse collection of information, students can develop a comprehensive understanding of road safety challenges, observe how trends change over time, and explore the impact of various safety measures.
Using data effectively enables the development of targeted strategies aimed at reducing road trauma and saving lives—both in our communities and around the world. Incorporating these resources into your teaching supports critical thinking and encourages students to become informed, responsible road users.
Datasets
Local Government LGA summary allows for easy access to local government area crash statistics
State - TfNSW Interactive crash statistics - provides detailed analysis of road crashes, fatalities, and injuries, which can be filtered by Local Government Area (LGA), age, gender, and road user type.
National - Road Safety Data Hub | Office of Road Safety - a dashboard of interactive, evidence-based statistics to monitor road safety and support the National Road Safety Strategy 2021–30, which aims to reduce deaths by 50% and serious injuries by 30% by 2030.
Worldwide statistics - YOURS (youthforroadsafety.org) Infographic on youth and road deaths - a global issue facing young people.
Definitions and notes - how to interpret statistics
Last modified date
13/04/2026
Business unit contact email
Executive director
Megan Kelly
Executive director’s business unit
Teaching Learning&Student Wellbeing